Missed Calls Are a Clinical Problem, Not a Front Desk Problem

Most practices count a missed call as a staffing problem, a schedule gap rather than a care gap. The phones rang harder than two people could answer. Calls rolled to voicemail. The fix gets framed as hiring or shifts. That framing lasts because we count the miss where it happens, at the front desk, and not where it lands.
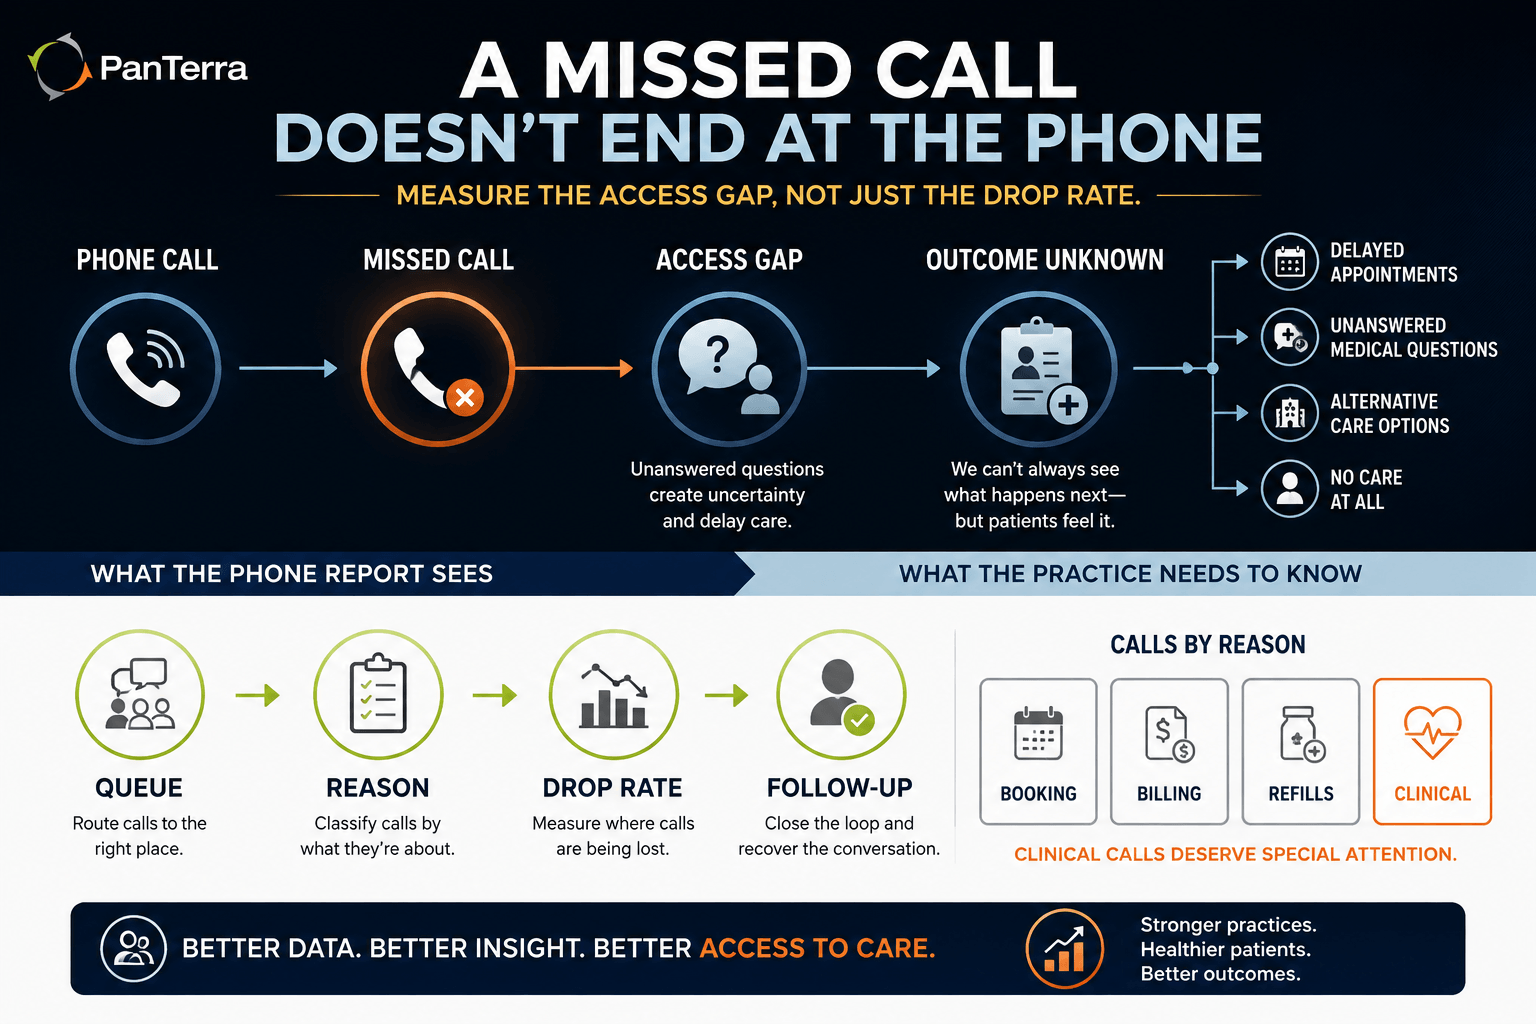
It lands in the chart — in the record, weeks later. A patient who cannot reach the office to ask if a symptom matters does not stop having it. They wait. They go to an urgent care that has no chart on them. Or they do nothing at all. The call that never went through becomes a clinical event weeks later. No phone report shows the link.
This article argues that answer rate belongs on the quality board, not just the ops board. It also shows what the survey data can and cannot tell you.
Key Takeaways
- The national patient survey treats phone response as an access to care item, not a service item. The main source for it has not been updated since 2020.
- - The CAHPS Clinician and Group Survey scores same day phone response inside its Getting Timely Appointments, Care, and Information composite. That makes it an access measure, not a service one.
- - In the 2016 database results, only 58% of adult respondents on Survey 2.0 gave a top box answer on the same day phone item. After hours scored 62%.
- - AHRQ suspended new submissions to that database in 2021. So a practice that scores itself against it today is judging itself by how patients behaved before 2020.
- - Phone systems report dropped calls. Almost none report what the caller wanted, and that is the one thing that makes the number mean something in a clinic.
- - You can close the gap with data you already produce. It is a change to the report, not a new system.
Who This Is For
Best for: practice managers, quality leads, and clinical leads at multi site medical, dental, and behavioral health groups who own both patient scores and the phones.
Not ideal for: solo practices with one line and no queue, where the volume is too low to show a pattern.
Top use cases: making the case for phone spend in clinical terms, getting ready for a survey cycle, and choosing what to track before you switch vendors.
Why Does the Patient Survey Treat Phone Response as a Care Measure?
Because the people who built it decided that a patient who cannot reach you has not had care, however good the visit was.
The CAHPS Clinician and Group Survey is the standard tool US practices use to measure patient experience. It groups its telephone items inside the composite named Getting Timely Appointments, Care, and Information. The same group holds items about urgent visits and routine check ups. The phone question sits beside them. It does not sit off in a service section. You can read the full CG-CAHPS measure list at AHRQ.
That placement is the argument. By the survey's own logic, a call you did not answer in office hours is the same kind of failure as an urgent visit the patient could not get. Your practice may feel those two very differently. Your patient does not.
The composite that holds the phone item: Getting Timely Appointments, Care, and Information, the CG-CAHPS access composite, which also covers urgent and routine appointments.
What Does the Available Data Actually Show?
It shows a middling number that is now old. The age matters as much as the number.
The AHRQ CAHPS Clinician and Group Survey Database pooled results that practice sites and medical groups sent in by choice. In the 2016 results, the top box score for adults on Survey 2.0 answering the same day phone item was 58%. The after hours equivalent scored 62%. The overall access composite for that group came in at 58%, which AHRQ flagged as a drop against the 2010 to 2015 range, where scores had held steady.
Why 2016 is the wrong number to plan against
AHRQ stopped taking new data in 2021 and cited falling take up. Published chartbooks run through 2019. So any figure a practice pulls from it today describes how phones ran before the pandemic surge, before portal messaging took hold, and before the current market for front desk staff.
Which way the error runs is not obvious, and that is the problem. Portal messaging may have pulled routine questions off the phone and lifted answer rates since then. Staffing shortages may have pushed them down. A practice that aims at 58% is aiming at a number that no longer describes anything real.
What to do with it instead
Use the survey, not the benchmark. The wording is stable and still in use, so it tells you what patients get asked, and so what your scores will show. Treat the 2016 figures as history and label them that way in any board deck.
Why Do Phone Reports Miss the Clinical Signal?
Because they count calls, and the thing that matters in a clinic is what the call was about.
A typical report gives you inbound volume, answer rate, average speed to answer, and abandonment. Every one of those treats calls as the same. A patient confirming an address and a patient describing chest tightness each count as one.
This is where the front desk framing does its harm. If all calls are equal, drop rate is a throughput problem and the answer is more hands at peak. If calls are not equal, a 6% drop rate packed into the clinical queue is a different problem than 6% spread evenly across booking confirmations.
The three question test
Run any phone report past three questions before you treat it as an ops document.
- Can you split the drop rate by what the caller wanted? If the queue does not split clinical questions, refills, and booking, the number tells you nothing.
- Do you know what those callers did next? Someone who calls back in four minutes is a different case from someone who never calls again. Repeat caller data answers this.
- Can you see after hours on its own? The survey scores after hours as its own item. If your report folds it into a daily total, you cannot see the thing your patients get asked about.
A practice that answers all three has turned a phone metric into a clinical one. Most cannot answer the first one.
What Should a Practice Measure Instead?
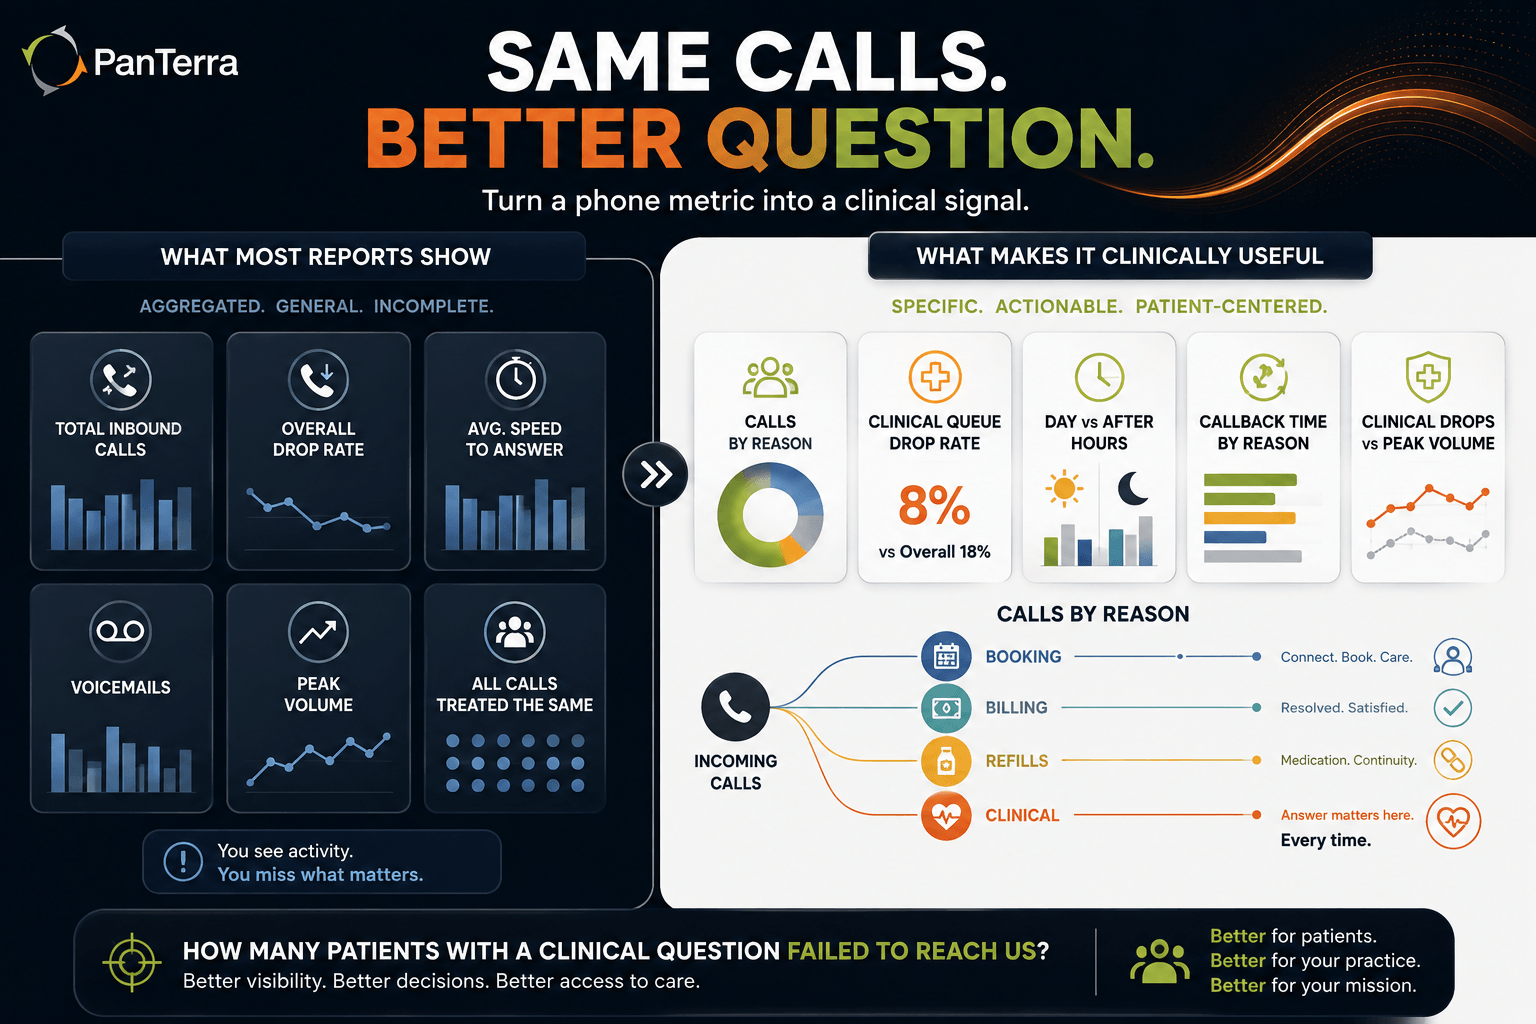
Start with the smallest change that gives you a number a clinician can read. Tag the queue with a reason, then report drop rate by reason.
Most multi site practices already route calls into queues for booking, billing, refills, and clinical questions. That routing is your reason code. The gap is the report, not the data. It sits in the platform, and the default report rolls it into one figure.
|
What most reports show |
What makes it clinically usable |
|---|---|
|
Total inbound calls |
Inbound calls by queue and reason |
|
Overall drop rate |
Drop rate inside the clinical queue |
|
Average speed to answer |
Speed to answer in hours and after hours, reported separately |
|
Voicemails left |
Voicemails left plus time to callback, by reason |
|
Peak hour volume |
Peak hour volume set against clinical queue drop rate |
The right column is not a feature list. It is a report setup, and most current platforms can do it, ours included. The work is choosing to look at the data that way, then holding the view steady long enough to trend it.
The question this finally lets you ask
Once the drop rate carries a reason, you can ask the question that earns the budget. How many patients with a clinical question failed to reach us last quarter, and what happened to them?
That is a chart review question, and a sample answers it. Pull a month of dropped clinical queue calls, match the numbers to the record, and look at the next visit. Most practices that run this once need no more convincing.
What This Argument Does Not Claim
Three limits are worth stating plainly. Reaching too far here would weaken the case.
First, no published study links a given drop rate at a practice to a given clinical outcome. The claim here is that the measure is filed in the wrong place. It is not that some figure causes some harm.
Second, where CG-CAHPS puts the phone items is a design choice by the people who wrote it. That is strong evidence for how patient surveys treat the phone. On its own it is not evidence of a clinical outcome.
Third, a better system does not create front desk capacity. It can route, queue, escalate, and report. It cannot answer a call nobody is there to take. Fix the platform and not the staffing, and you end up with better data about the same problem.
Frequently Asked Questions
Is call abandonment rate a patient safety metric?
No accrediting body treats it as one. It works as a fair early warning for access problems, and CG-CAHPS treats phone response as an access measure. Treat it as a signal worth a look, not a proven safety measure.
What is a good answer rate for a medical practice?
No current national benchmark holds up. The main source stopped taking data in 2021 and its last chartbook covers 2019. Trend your own rate quarter by quarter, split by call reason. That beats aiming at a stale outside figure.
Does the CAHPS survey ask patients about phone calls?
Yes. It asks if the patient got an answer to a medical question the same day when they phoned in office hours, and how fast they got one after hours. Both sit inside the access group.
Should after hours calls be measured separately from daytime calls?
Yes. The survey scores them apart, so folding them together at your end hides the exact thing your patients get asked. The two also run on different staffing and carry different risk.
Will a new phone system improve our patient experience scores?
Only if your limit is routing, visibility, or after hours cover, not if it is headcount. If too few people answer at peak, a new platform gives you a clearer view of the same problem. Work out which one you have before you buy.
How do we start segmenting calls by reason without a big project?
Use the queues you already run. If calls route apart for booking, refills, billing, and clinical questions, that routing is your reason code. The change you need is to the report, not the phone tree.
Related Reading
- Running phones for 11 clinics with a team of two, on how multi site practices set up routing and cover with a small team
- Queue, routing, and reporting capabilities referenced above
.jpg?width=500&height=500&name=Are%20you%20Getting%20a%20Good%20Deal%20(1).jpg)
Comments